Resist or React: A Comparison of Chemical Resistance
Introduction
In the last article, Chilling Out: Evaluating Polymeric Materials at Low Temperatures, we showed a comparison of how the eight selected materials faired when subjected to high temperatures. In this article, we will look at how those eight materials do when exposed to 4 different chemical conditions.
Materials
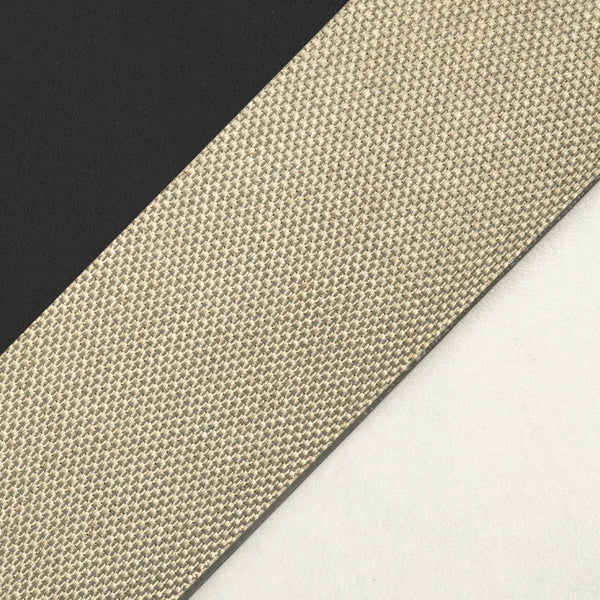
To get a better feel for how different materials behave when exposed to various chemicals, our material selection includes a wide range of materials. Below in Table 1, is a listing of the materials selected for evaluation.
|
|
Material Name
|
Material Description |
|
Polymer Films |
63-20
|
Polyvinyl chloride film (20 mil) |
|
FEP-5
|
Fluorinated ethylene propylene film (5 mil) |
|
|
PFR-10
|
Polyether-based polyurethane film (10 mil) |
|
|
FSR-16
|
Fluorinated rubber film (16 mil) |
|
|
Coated Fabrics |
VNH (LT)-23
|
Polyvinyl chloride coated nylon fabric (23 mil) |
|
PVL-10
|
Polyvinyl chloride coated polyester fabric (10 mil) |
|
|
RPH-14
|
Polyurethane coated polyester fabric (14 mil) |
|
|
Fabric |
Trevira
|
Canvas fabric (15 mil) |
How Can We Compare These Materials?
Tensile strength will be tested, as was done in the previous installments. Here, we will be looking to see how each material reacts to 4 different chemicals, which may represent common chemicals used in many of our customer’s industries. Just as introduced in the other articles, chemical degradation can also occur at different scales. The most visible change is usually through degradation at the macroscale. Here, discoloration, swelling or dissolution of the material are types of visual cues that the material is undergoing a change as a result to chemical exposure. Moving on to the microscale degradation, these changes most likely will not be visible, but would be observed by checking certain properties. Degradation that can occur at the microscale would include plasticizer leaching, hydrolysis, crazing or surface degradation via etching or erosion. Finally, at the molecular level, as discussed before, chain scission, oxidation or cross-linking are some possible ways of degradation.

Experimental Test Set-Up
Four chemicals were used in this evaluation, which included, gasoline, hydrogen peroxide (35%), quaternary-based disinfectant and salt water (equal to the salinity of the ocean). Samples were tested at 4 intervals, 0 days, 1 day, 7 days and 28 days. After each interval was reached, samples were removed from the chemicals and conditioned for 1 day, prior to testing. Tensile strength was determined by a modified version of ASTM D638.
Results
It should be noted that typically fabric, elastomeric and non-elastomeric samples follow different protocols when measuring tensile strength. The values here should only be regarded as qualitative values for comparison, rather than actual values of measured tensile strength.


Based on the data collected from this comparative study, we can conclude how these materials behave in a chemical resistance test of select chemicals. Below in Table 2, the overall ranking of the materials for each chemical is listed.
|
Material |
Gasoline Ranking |
Disinfectant Ranking |
Hydrogen Peroxide Ranking |
Salt Water Ranking |
|
63-20 |
6 |
7 |
6 |
6 |
|
FEP-5 |
1 |
1 |
1 |
1 |
|
PFR-10 |
7 |
6 |
5 |
8 |
|
FSR-16 |
8 |
8 |
7 |
7 |
|
VNHLT-23 |
3 |
4 |
8 |
3 |
|
PVL-10 |
5 |
5 |
3 |
4 |
|
RPH-14 |
4 |
3 |
4 |
5 |
|
Trevira |
2 |
2 |
2 |
2 |
Table 2. Listing of the ranking based on how the material changed in tensile strength when comparing the baseline (day 0) to the final interval (day 28). The absolute magnitude was used rather than if the value was positive or negative.
The most stable material was FEP-5. This film did not have very big swings from one interval to the next for all of the chemicals used in this study. While Trevira did show rather significant changes, the material was able to come back to the baseline in tensile strength at the conclusion of the testing. The polymer films (FSR-16, FEP-5, 63-20, PFR-10) as a whole were rather stable after an initial increase at the beginning of each test.
Final Thoughts
Over time many of these materials did exhibit changes in feel. For samples with increasing tensile strength, often times the samples would feel more rigid or have some slight curling. PFR-10 did swell when subjected to gasoline, but returned to the original size during the conditioning step. RPH-14 did show some dissolution of the polymer coating in gasoline, as when the samples were removed, the surface was slightly sticky. After conditioning, the stickiness had diminished.
This testing should help to show the importance of understanding how the conditions of an application need to be fully vetted, as some of these materials are not suitable for long term usage when subjected to these types of chemicals.
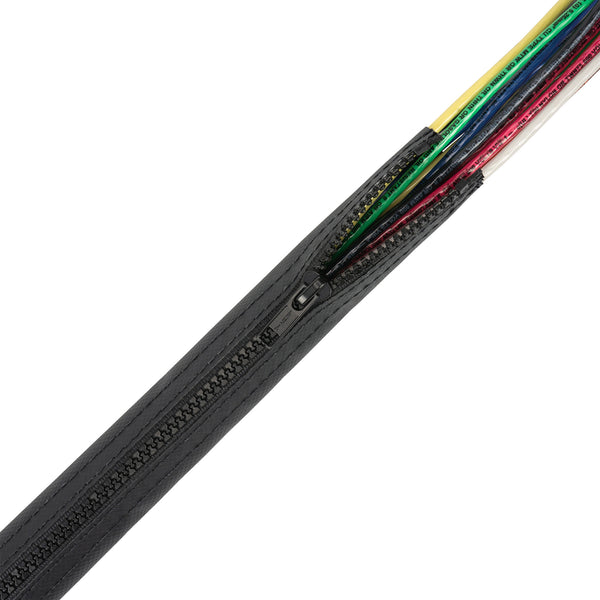
This testing was designed to act as a worse case scenario, since these were submerged for up to 28 days. As an example, in an application in healthcare, cleaning may not require a material to be submerged, rather it is exposed to small amounts for a few minutes at a time before being wiped down. In essence, if we were to be cleaning a cable sleeve on a robotic arm in an operating room, cleaning of the sleeve would happen before and after surgeries each day. If on average there are 5 surgeries and the room is cleaned at the beginning of the day and after each surgery, that would be a total of 6 times. Let’s say the contact time needed to clean was 5 minutes before wiping off. The sleeving would be seeing a total of 30 minutes each day of cleaner. This test ran for 28 days which equates to 40,320 minutes. This would mean that the data collected in this study is reflective of how these materials would do roughly after 8,064 cleanings. Keep in mind that the behavior of these materials may be different in this setting since they are never submerged, only sprayed and wiped down, so this could be a conservative number. The example used here is not a guarantee of performance, rather as an idea of how this type of testing could be applied in the field.
Contact our in-house engineers today!